
Misconceptions about Vibration Analysis
Many agencies in the field of Condition Monitoring often falsely claim to rely solely on Vibration Analysis as the primary tool for monitoring equipment health. This can be attributed to either a lack of understanding about Condition Monitoring or an attempt to deceive their customers. The process of Condition Monitoring with Vibration Analysis is indeed challenging, as it does not incorporate trend analysis. Furthermore, CM vendors do not provide their customers with the trend of spectrum and waveform of vibration in their CM reports. Condition Monitoring involves comparing the most recent measurements of various parameters such as Vibration, Temperature, Ultrasound, Oil Condition, Pressure, Current, etc. with previously recorded readings obtained using the same testing instrument, sensor, and machine component under Condition Monitoring.
Vibration Analysis, although a valuable tool for condition monitoring, can be costly, time-consuming, and challenging. I’ll explain why.
To begin with, it is important to clarify that Vibration Measurement and Vibration Analysis are distinct concepts. Vibration Measurement serves as a tool for Condition Monitoring rather than being synonymous with Vibration Analysis.
What is the difference between Vibration Measurement & Vibration Analysis?
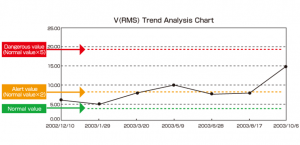
Vibration Measurement involves the collection of vibration data at the DE and NDE sides of equipment in three directions: vertical, horizontal, and axial. These numerical figures can be easily plotted on a chart for trend analysis and close monitoring. By comparing radial readings with axial readings and horizontal readings with vertical readings, we can make a simple judgment about the overall vibration of the asset.
Vibration Analysis encompasses various techniques such as FFT Spectrum analysis, Time Waveform Analysis, Phase Analysis, Orbit Analysis, Octave Analysis, Bump Test, Run Up – Coast Down Test, Bode Chart, Nyquist Plot, Cepstrum Vibration Analysis, Modulation – Demodulation, and more.
Essentially, it involves conducting a comprehensive examination of vibrations in various aspects. This entails analyzing diverse graphs and waveforms. As evident from the previous explanation, the analysis of trends in multiple graphs and waveforms is a challenging task, particularly when dealing with numerous machines.
Figure 1 Condition Monitoring by plotting Trend of Overall vibration collected from one point on the machine.
Figure 2 – Waterfall Chart of Spectrum taken periodically
 If we refer to Figure 1 & 2 above, we can easily conclude that monitoring the amplitude of different frequencies in a waterfall chart, fig 2, is a tedious process if compared with a simple trend in figure 1.
Vibration Analysis is an effective tool for condition monitoring of various equipment, with the exception of Gear Boxes. In the case of Gear Boxes, Vibration Analysis is the only tool that can accurately assess the condition of internal components. The complexity of vibration in gear boxes, with multiple Gear Mesh Frequencies (GMF) and Bearing Frequencies, makes it challenging to monitor the condition of gears and bearings using overall vibration analysis. Unlike other machines, there is no easy tool like Ultrasound Analysis available for monitoring gears and bearings in gear boxes. Therefore, periodic analysis of FFT spectrums using Waterfall Plot or Spectrogram is necessary to monitor vibration at different frequencies, such as GMF and Bearing Frequencies. This complexity makes condition monitoring of gear boxes extremely time-consuming and challenging.
Vibration Analysis primarily serves as a key tool for root cause analysis (RCA) rather than for Condition Monitoring.
The second crucial point is that Vibration Analysis (VA) is not a suitable tool for monitoring bearings. By default, the Vibration Analyzer is set to RMS mode, which primarily displays the 1x frequency and its harmonics, while bearing frequencies are barely noticeable. The graph does not show the sidebands of different bearing frequencies. To effectively monitor bearings, it is necessary to collect data in Pk-Pk mode and focus solely on the bearing frequency range. Periodically monitoring the FFT Spectrum of these bearing frequencies in a spectrogram is essential. Monitoring four major bearing frequencies (BPFO, BPFI, BPF, and FTF) with VA becomes a tedious, time-consuming, and challenging process. In contrast, Ultrasound Analysis provides an easier solution. With Ultrasound Analysis, you can easily plot a trend of Ultrasound Peak and RMS values of the bearing taken at regular intervals. The crest factor of Ultrasound aids in more precise determination of the bearing’s condition.
Conclusion:
- Vibration Analysis is not better tool of condition monitoring except condition monitoring of Gear Boxes.
- To monitor condition of faults like Misalignment, Unbalance, Bent Shaft, Eccentricity etc, vibration measurement will be the best tool.
- To monitor condition of bearings Ultrasound Analysis will be the best tool to be used.
